Reports
OnTakt’s built-in reporting allows users at all levels to track the metrics they need to improve operations. Be it one-time reports or scheduled reports, OnTakt’s reporting module has you covered.

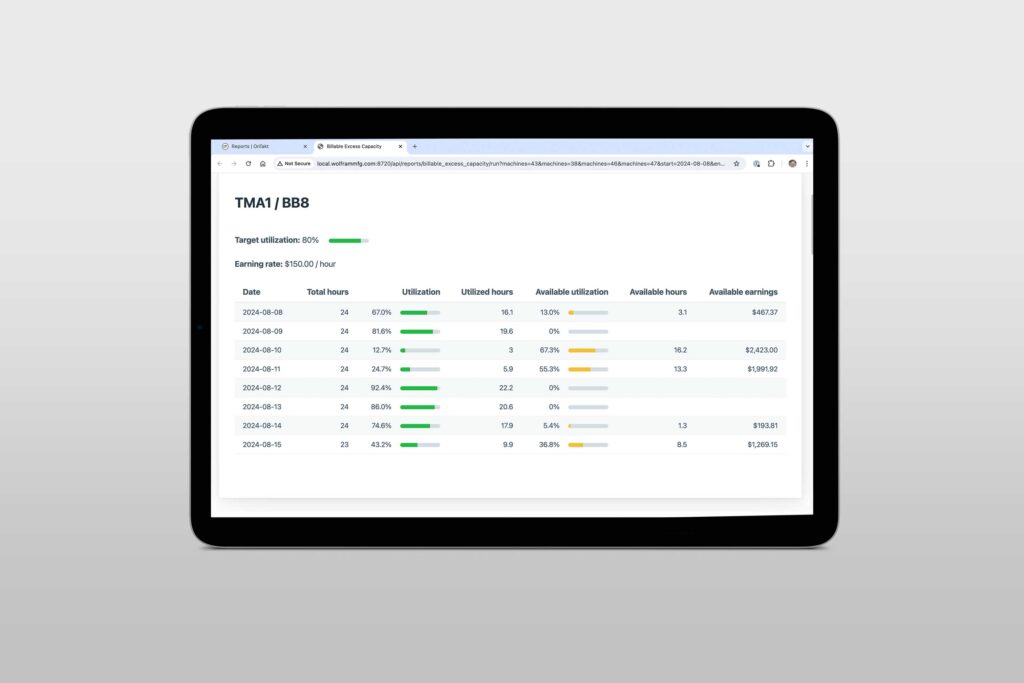
Excess Capacity Report
OnTakt’s Billable Excess Capacity report gives the executive team a quick read, in dollar terms, of which machines are leaving money on the table by underperforming and what additional resources they need to be more productive. The Excess Capacity Report also tells management when resources are maxed out and new equipment should be brought online.
Downtime Report
OnTakt’s Downtime Report helps your operations team better understand what is consistently stopping machines – and more importantly, why. The Downtime Report quantifies how much money downtime has cost. Leverage the Downtime Report to budget fixes for the problems and then use it to track the ROI of the fixes that are put in place.
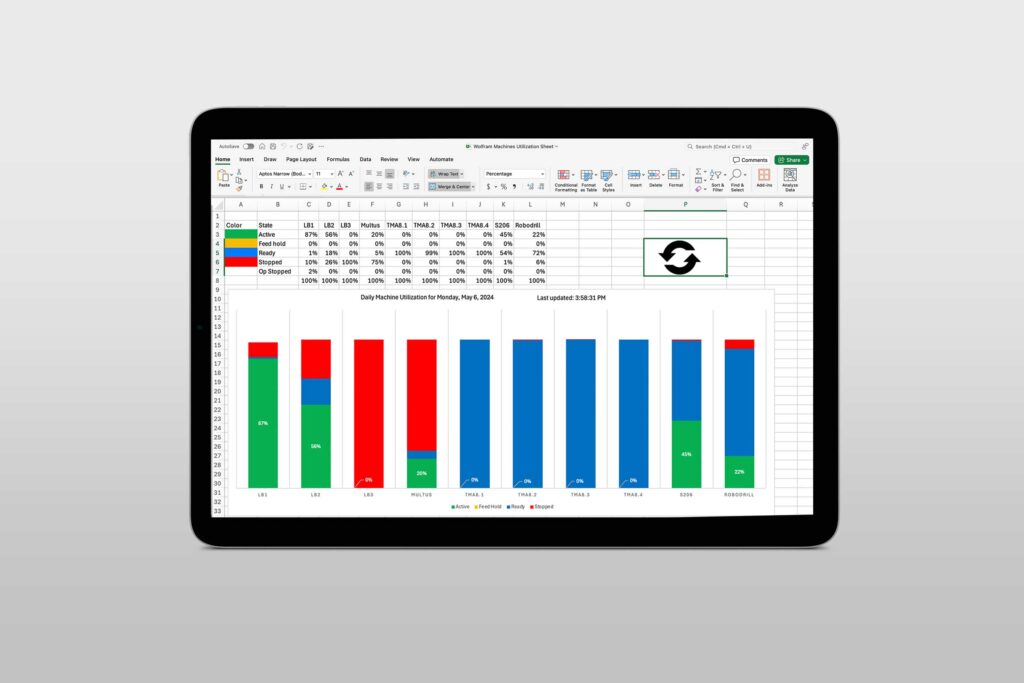
Export Data
Easily export data and populate in real time into your existing Excel spreadsheets with OnTakt’s built-in REST API. Once the data is in Excel, it is easy to customize your reports across any relevant period.
Gain Additional insights With
OnTakt's Full Reporting Capabilities
Alarms
Counts the number of times each NC and TMAC alarm occurred on each machine selected, then calculates the amount of money TMAC saved as defined in cost savings estimation.
Billable Excess Capacity
Compares the target and actual utilization of machines in terms of billable time.
Downtime
Analyze machine downtime by reason to idenifty opportunities for process improvement.
Goal Status
Indicates whether each selected machine is expected to reach its part goal on the current day.
Kudos
Ranks users by how many kudos their notes received during the selected time window.
Machine Runtime
Breaks down the total runtime on the machines during the selected time window by process.
Machine State
State history details for selected machines over a given timeframe.
Maintenance Training Matrix
How many times each user has successfully completed each maintenance item and the average completion time (in minutes).
Part Cycle Report
A list of parts completed with details about their cycle time over a given time period.
Production Overview
The total number of parts produced and the average cycle time per part for each day of the selected year for each selected machine.
Production Summary Report
Per-shift breakdown of part production, state history, and machine utilization.
TMAC Limit Suggestions
Calculate TMAC wear and extreme limits based on historical work data.
Tool Alarms
The number of TMAC alarms triggered by each tool
Tool Location History
Tools that have been used in a specific location in a machine
Tool Stock Remaining Time
How long production can continue based on the stock of each inventory item that is currently in use.
Tool Usage
The number of replacements expected vs. the number of replacements made for each tool that was replaced on the selected machines during the selected time window.
Tool Work
TMAC work done by a chosen tool charted alongside its replacement history
Tooling Cost
Shows the cost of each tool per part produced by each of the selected processes
Utilization History
Utilization of the selected machines charted over time
Ready to get started?
Find out how OnTakt enables machine shops of all sizes to easily leverage data to increase productivity and profitability.